Home › Bank charge-off report
Bank charge-off report: the 30 largest US banks (Q2 2026)
Data through Q2 2026 (FDIC call reports, reporting date June 30, 2026, via BankWatch Pro)
Short answer: The 30 largest FDIC-insured banks reported $31.52B in net charge-offs for January–June 2026 (FDIC call reports, Q2 2026). Capital One, N.A. had the most in dollars ($7.49B) and Synchrony Bank had the highest rate (5.39%, annualized) (FDIC call reports, Q2 2026).
Institutions are ranked from public regulatory data. Being listed doesn't mean an institution sells debt, is a client of SellChargeOffs, or endorses us.
Which banks had the most net charge-offs?
| Bank | Net charge-offs (FDIC, Q2 2026 YTD) |
|---|---|
| 1. Capital One, N.A. VA | $7.49B |
| 2. JPMorgan Chase Bank, N.A. OH | $4.69B |
| 3. Citibank, N.A. SD | $3.88B |
| 4. Bank of America, N.A. NC | $2.82B |
| 5. Synchrony Bank UT | $2.65B |
| 6. American Express National Bank UT | $2.06B |
| 7. Wells Fargo Bank, N.A. SD | $1.98B |
| 8. U.S. Bank National Association OH | $1.08B |
| 9. Truist Bank NC | $905.0M |
| 10. Ally Bank UT | $810.0M |
Net charge-offs are charge-offs minus recoveries, January–June 2026 (FDIC call reports, Q2 2026).
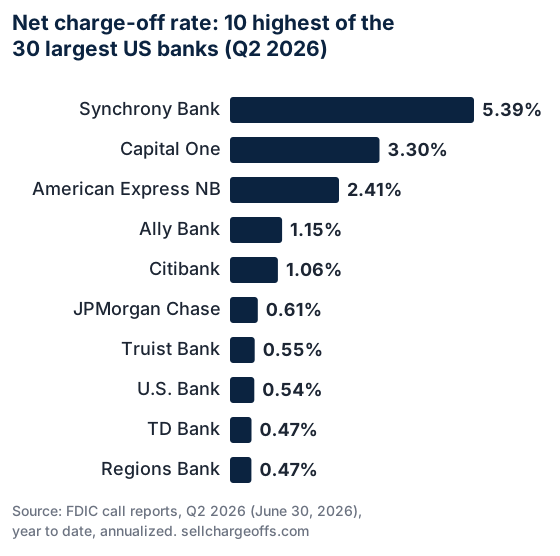
Which banks had the highest charge-off rates?
| Bank | Rate (FDIC, Q2 2026 YTD, annualized) |
|---|---|
| 1. Synchrony Bank UT | 5.39% |
| 2. Capital One, N.A. VA | 3.30% |
| 3. American Express National Bank UT | 2.41% |
| 4. Ally Bank UT | 1.15% |
| 5. Citibank, N.A. SD | 1.06% |
| 6. JPMorgan Chase Bank, N.A. OH | 0.61% |
| 7. Truist Bank NC | 0.55% |
| 8. U.S. Bank National Association OH | 0.54% |
| 9. TD Bank, N.A. DE | 0.47% |
| 10. Regions Bank AL | 0.47% |
Who rose quarter over quarter?
Of the 30 banks, 10 reported higher net charge-offs in Q2 2026 than in Q1 2026, 19 reported lower and 1 was unchanged (FDIC call reports, Q1 and Q2 2026). The largest increases were at Goldman Sachs Bank USA ($59.0M to $262.0M) and Citibank, N.A. ($1.84B to $2.04B). Combined, the 30 banks went from $15.85B to $15.66B (FDIC, quarterly net charge-offs, Q1 vs. Q2 2026).
| Bank | Q1 2026 (FDIC) | Q2 2026 (FDIC) |
|---|---|---|
| Goldman Sachs Bank USA NY | $59.0M | $262.0M |
| Citibank, N.A. SD | $1.84B | $2.04B |
| JPMorgan Chase Bank, N.A. OH | $2.32B | $2.37B |
| Synchrony Bank UT | $1.32B | $1.34B |
| PNC Bank, N.A. DE | $206.5M | $225.4M |
How this report is built
- Banks: the 30 largest FDIC-insured banks by total assets on June 30, 2026.
- Year-to-date net charge-offs and the annualized rate are as filed in the call report (FDIC fields NTLNLS and NTLNLSR).
- Quarterly figures: Q2 2026 gross charge-offs minus recoveries (DRLNLSQ, CRLNLSQ); Q1 2026 is the Q1 year-to-date figure.
- Not shown: breakdowns by state and by asset size, because the data feed used here returns bank charge-off figures one bank at a time rather than for every insured bank.
- Download: data (CSV), chart (SVG). Sources: FDIC BankFind Suite; national trend by loan type in charge-off accounting.
See if buyers are interested in your charged-off accounts
Confidential introductions to debt buyers, free for sellers of charge-off portfolios. Summary business data only, and a mutual NDA before any documents. No obligation. We are paid by buyers through a per-introduction fee; sellers pay nothing.
Where should you go next?
- Credit union charge-off report
- Charge-off accounting
- Debt sales for banks and credit unions
- Sell charged-off debt to debt buyers
General information only, not investment, accounting or legal advice. Institutions are ranked from public regulatory data. Being listed doesn't mean an institution sells debt, is a client of SellChargeOffs, or endorses us. SellChargeOffs only introduces sellers to buyers. It is not a debt buyer, a broker or a collector. We are paid by buyers through a per-introduction fee; sellers pay nothing.