Home › Credit union charge-off report
Credit union charge-off report (Q2 2025)
Data through Q2 2025 (NCUA 5300 call reports, cycle date June 30, 2025, via CUWatch Pro; the latest quarter in that feed)
Short answer: The 4,460 federally insured credit unions reported $6.58B in net charge-offs for January–June 2025, 0.39% of loans (NCUA call reports, Q2 2025, year to date, not annualized). Navy Federal Credit Union had the most ($1.65B), and credit unions with $10B or more in assets had the highest rate of any size group (0.66%) (NCUA call reports, Q2 2025).
Institutions are ranked from public regulatory data. Being listed doesn't mean an institution sells debt, is a client of SellChargeOffs, or endorses us.
Which credit unions had the most net charge-offs?
| Credit union | Net charge-offs (NCUA, Q2 2025 YTD) |
|---|---|
| 1. Navy Federal Credit Union VA | $1.65B |
| 2. Pentagon VA | $215.7M |
| 3. State Employees' NC | $120.9M |
| 4. SchoolsFirst CA | $106.9M |
| 5. Mountain America UT | $99.9M |
| 6. Suncoast FL | $85.6M |
| 7. America First UT | $74.1M |
| 8. First Technology CA | $71.9M |
| 9. Alliant IL | $69.3M |
| 10. Boeing Employees WA | $63.0M |
Which had the highest rates? ($1B+ in assets)
| Credit union | Rate (NCUA, Q2 2025 YTD, % of loans) |
|---|---|
| 1. Oregon Community OR | 1.59% |
| 2. Connexus WI | 1.44% |
| 3. Navy Federal Credit Union VA | 1.20% |
| 4. Lafayette MD | 1.09% |
| 5. TTCU OK | 1.07% |
| 6. Vibrant IL | 1.05% |
| 7. Hughes AZ | 1.04% |
| 8. Pentagon VA | 0.91% |
| 9. Farmers Insurance CA | 0.90% |
| 10. OnPath LA | 0.87% |
Among the 461 credit unions with $1B or more in total assets. Rates are net charge-offs for January–June 2025 divided by loans at June 30, 2025, not annualized (NCUA call reports, Q2 2025).
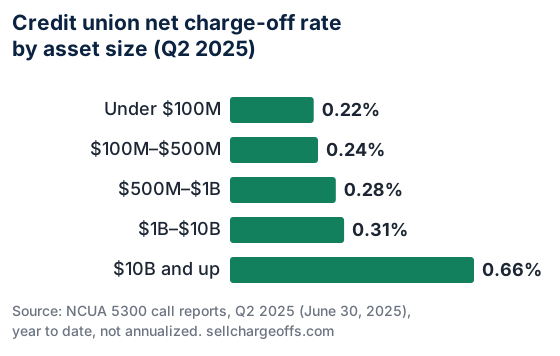
How do rates differ by asset size?
| Asset size | Credit unions (NCUA, Q2 2025) | Net charge-offs (NCUA, Q2 2025 YTD) | Rate (NCUA, Q2 2025 YTD, % of loans) |
|---|---|---|---|
| Under $100M | 2,634 | $93.1M | 0.22% |
| $100M–$500M | 1,077 | $371.9M | 0.24% |
| $500M–$1B | 288 | $407.6M | 0.28% |
| $1B–$10B | 439 | $2.79B | 0.31% |
| $10B and up | 22 | $2.92B | 0.66% |
Which states had the most?
| State | Net charge-offs (NCUA, Q2 2025 YTD) | Rate (NCUA, Q2 2025 YTD, % of loans) | Credit unions (NCUA, Q2 2025) |
|---|---|---|---|
| VA | $2.00B | 1.01% | 96 |
| CA | $626.2M | 0.31% | 245 |
| TX | $414.6M | 0.36% | 389 |
| FL | $330.1M | 0.39% | 112 |
| WA | $236.9M | 0.35% | 76 |
| NY | $228.0M | 0.27% | 275 |
| NC | $219.0M | 0.36% | 58 |
| UT | $199.2M | 0.41% | 54 |
| IL | $196.3M | 0.38% | 199 |
| MI | $186.1M | 0.24% | 177 |
Top 10 of 54 states and territories by headquarters state (NCUA call reports, Q2 2025). All 54 are in the CSV below. Virginia includes Navy Federal and Pentagon.
Who rose quarter over quarter?
Of the 22 credit unions with $10B or more in assets, 6 reported higher net charge-offs in Q2 2025 than in Q1 2025 and 16 reported lower (NCUA call reports, Q1 and Q2 2025). The largest increase was at Idaho Central ($9.9M to $14.1M). Combined, the 22 went from $1.50B to $1.42B (NCUA, quarterly net charge-offs, Q1 vs. Q2 2025).
| Credit union | Q1 2025 (NCUA) | Q2 2025 (NCUA) |
|---|---|---|
| Idaho Central ID | $9.9M | $14.1M |
| Digital MA | $27.6M | $29.6M |
| The Golden 1 CA | $26.9M | $28.6M |
| United Nations NY | $2.0M | $2.5M |
| Randolph-Brooks TX | $19.1M | $19.7M |
How this report is built
- All 4,460 federally insured credit unions that filed a 5300 call report for June 30, 2025.
- Net charge-offs are total charge-offs minus recoveries, year to date. Q2 2025 quarterly figures are the June year-to-date figure minus the March year-to-date figure.
- Group rates are total net charge-offs divided by total loans for the group.
- Download: data (CSV), chart (SVG). Source: NCUA call report data.
See if buyers are interested in your charged-off accounts
Confidential introductions to debt buyers, free for sellers of charge-off portfolios. Summary business data only, and a mutual NDA before any documents. No obligation. We are paid by buyers through a per-introduction fee; sellers pay nothing.
Where should you go next?
General information only, not investment, accounting or legal advice. Institutions are ranked from public regulatory data. Being listed doesn't mean an institution sells debt, is a client of SellChargeOffs, or endorses us. SellChargeOffs only introduces sellers to buyers. It is not a debt buyer, a broker or a collector. We are paid by buyers through a per-introduction fee; sellers pay nothing.